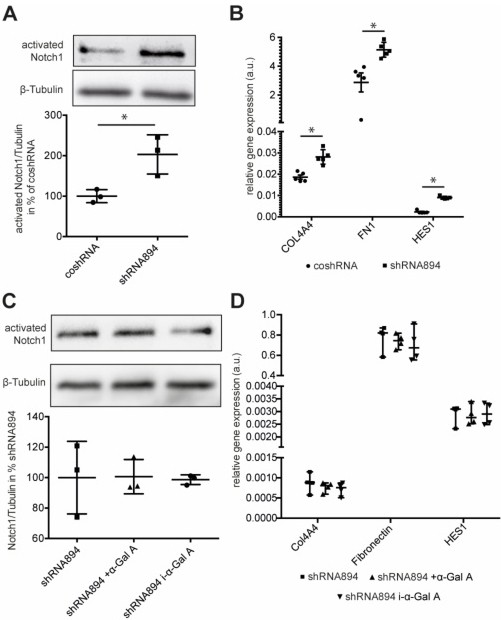
Fig. 3. Profibrotic signaling in α-Gal A-deficient podocytes at baseline and under ERT. (A) Representative cleaved Notch1 and β-tubulin immunoblot and densitometric quantification of cleaved Notch1/ß-tubulin immunoblot. Band intensity of cleaved Notch1 was normalized to β-tubulin band intensity (mean ± SD, n=3, Students t-test, * = p<0,05). (B) RT-qPCR of HES, Col4A4, FN1 expression, normalized against ACTB expression in control (coshRNA) and α-Gal A-deficient podocytes (shRNA894) (mean ± SD, n=5, Students T-Test, * = p<0,05). (C) Representative cleaved Notch1 and β-tubulin immunoblot and densitometric quantification of cleaved Notch1/ß-tubulin immunoblot. Band intensity of cleaved Notch1 was normalized to β-tubulin band intensity (mean ± SD, n=3, 1-Way ANOVA). (D) RT-qPCR of HES, Col4A4, FN1 expression, normalized against ACTB expression in α-Gal A-deficient podocytes (shRNA894) and α-Gal A-deficient podocytes treated with active (+α-Gal A) or inactivated (i-α-Gal A) enzyme (mean ± SD, n=4, 2-Way-ANOVA).